1. INTRODUCTION
This is Part 2 of a series of articles covering the invention and development of Alloy 625. In Part 1, I discussed how the alloy was developed based on the effects of the different alloying elements on strength and creep resistance. I touched on the metallurgy of Alloy 625 in relation to how different heat treatments could influence the properties of the finished product. In this article, based on a paper produced by Stephen Floreen, Gerhard E. Fuchs, and Walter J. Yang [1], I cover the metallurgy of Alloy 625 in greater detail with particular regard to its solidification behaviour and how this affects the melting process.
2. SOLIDIFICATION BEHAVIOUR
Alloy 625 is essentially a solid-solution alloy. It has a face-centred cubic structure as indicated in Figure 1. This is what gives it its inherent toughness. The composition of Alloy 625 is a function of its original intended use.

As discussed in Part 1, Alloy 625 was originally invented as a replacement for Type 316 stainless steel in super critical stem power plants. The minimum nickel content was effectively fixed by the 649°C stress-rupture strength, which was found to peak at around 57%. The chromium and molybdenum contents of the prototype alloy were similar to those of Type 316 stainless steel; such that the alloy would exhibit comparable corrosion resistance. However, in order to increase the appeal of the alloy for more widespread applications, the amounts of chromium and molybdenum to their current levels shown in Table 1. Raising the levels of chromium and molybdenum was done primarily to increase the alloys room temperature tensile properties, but it also significantly improved its corrosion resistance. Niobium was added essentially a solid-solution strengthening element, but as will be discussed later, it can have a marked effect on the properties of the alloy depending on the presence of other elements (i.e. aluminium, titanium and carbon) and how the alloy is processed.
 Table 1 – Alloy 625 (UNS N06625) Composition (%)
Chromium is fundamental to providing corrosion protection in Alloy 625 through the formation of an adherent chromium oxide (Cr2O3) surface layer. The crystal structure of chromium is body-centred-cubic (bcc). The crystal structure of nickel is face-centred-cubic (fcc). These differences in crystal structure result in a binary phase diagram, as shown in Figure 2 [2]. This is really only of interest in the current discussion as it shows that chromium is in solid-solution in Alloy 625 (see Figure 1), as indicated by the red shaded area on the diagram.

Molybdenum is present not only to provide additional corrosion protection, but also solid-solution strengthening. The crystal structure of molybdenum is body-centred-cubic (bcc); like chromium. The differences in crystal structure between molybdenum and nickel give rise to a binary phase diagram, as shown in Figure 3 [3]. Again, this is really only of interest in the current discussion as it shows that molybdenum is in solid-solution in Alloy 625 (see Figure 1), as indicated by the red shaded area on the diagram.
Figure 4 shows the Cr-Mo binary phase diagram. It is not particularly relevant to the metallurgy of Alloy 625. It has only been included here for reference and to demonstrate the miscibility of chromium and molybdenum.

Unfortunately, it is not possible to describe the behaviour of Alloy 625 simply by studying the Ni-Cr, Ni-Mo and Cr-Mo systems in isolation. It is also necessary to look at the combined effects of nickel, chromium and molybdenum as well as other alloying elements. To do this, we need to introduce the concept of the ternary phase diagram. As its name implies, a ternary system is one having three components. It takes the form of a three-dimensional diagram representing, as variables, the temperature and two concentration parameters.
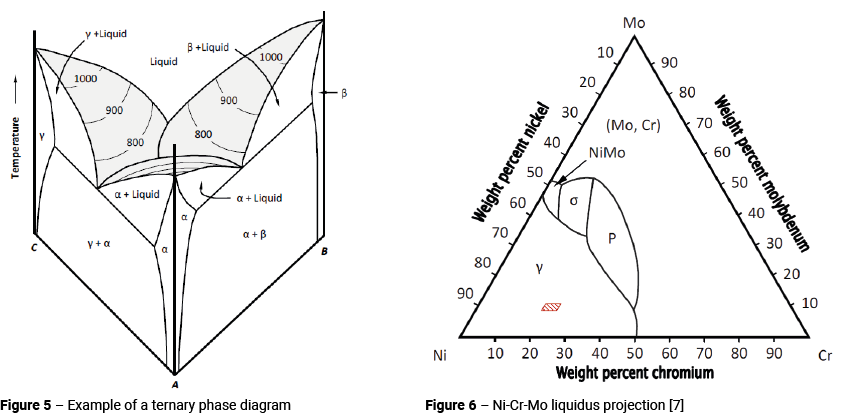
Figure 5 shows a simplified ternary phase diagram [5]. Binary phase diagrams are present along the three faces; one on each of the visible faces of the diagram, and a third binary between elements ‘B’ and ‘C’ hidden at the back. The top of the diagram shows a surface with contour's representing lines of constant temperature. These contours are called isotherms [6].
As it is presented in Figure 5, a ternary phase diagram is not much use. In order to investigate the interaction of the three components, it is normal to take a section through the diagram at a given temperature. Figure 6 shows the liquidus projection for the Ni-Cr-Mo system [7]. The red shaded area in Figure 6 represents the nickel, chromium and molybdenum contents found in Alloy 625.
Figure 6 demonstrates an important feature of the Ni-Cr-Mo system [8]. Whilst solidification will always begin as austenite (γ), molybdenum segregates to the liquid causing significant enrichment of molybdenum in the final liquid (see Figure 3). This promotes the formation of inter-metallic compounds at the end of solidification; principally Laves Phase, σ and P (σ is more likely to form in Alloy C-22 and P in Alloy C-276).
In the case of Alloy 625, Laves phase is an hexagonal close packed (hcp) intermetallic compound with an A2B type structure, as shown in Figure 7. The ‘A’ atoms shown in red can be Fe, Ni or Cr. The ‘B’ atoms shown in blue can be Mo, Nb or Si. Laves phases are named for Fritz Laves who first described them. The phases are classified on the basis of geometry alone. In general, the ‘A’ atoms are ordered as in diamond, hexagonal diamond, or a related structure, and the ‘B’ atoms form tetrahedra around the ‘A’ atoms. As a result, Laves phases are extremely hard and not plastically deformable at room temperature.

Niobium exhibits similar behaviour to molybdenum. It too segregates to the liquid during solidification, which results in the formation of niobium-rich Laves phase and/or niobium carbide during the final stages of solidification. A convenient way to view how niobium behaves is to consider the pseudo-ternary equilibrium diagram shown in Figure 8 [1, 9].
What Figure 8 indicates is that the C/Nb ratio dictates the solidification path and the resultant microstructures. Three different paths can be followed. Path 1, at high C/Nb ratios, leads to the formation of γ + NbC with no Laves phase. Path 2, at intermediate C/Nb ratios, leads first to γ + NbC, followed by Laves phase formation at the end of solidification. Path 3, at low C/Nb ratios leads to γ + Laves with no NbC.

The carbon content of Alloy 625 is generally sufficiently high to promote the formation of both carbides and intermetallics at the end of solidification. [10, 11] As previously discussed, solidification will always begin with austenite. Like niobium, carbon segregates aggressively to the liquid such that, as noted above, solidification terminates with the formation of eutectic type reactions involving NbC and/or Laves phase. In Alloy 625, Laves phase forms rather than Ni3Nb due to the presence of Cr, Mo, Fe, and Si (Cr, Mo, Nb, Fe and Si promote the formation of Laves phase).
NbC and Laves phase can be an issue if an ingot containing excessive amounts is hot-worked predominantly in one direction. The NbC particles can become strung out in planes to produce a banded microstructure. Whilst this type of microstructure may have acceptable properties when deformed in directions parallel to the bands, it can display very poor ductility when strained in directions perpendicular to them.
The loss of ductility resulting from the presence of Laves phase particles is far more severe than that due to the presence of NbC particles. Fortunately, Laves phase particles can be eliminated by solution annealing (1093°C minimum). Unfortunately, NbC particles are far more stable and, once formed, are virtually impossible to eliminate by conventional processing procedures. Their effects can be minimised using appropriate hot working practices that produce wrought products with reasonably uniform non-localised distributions of NbC.
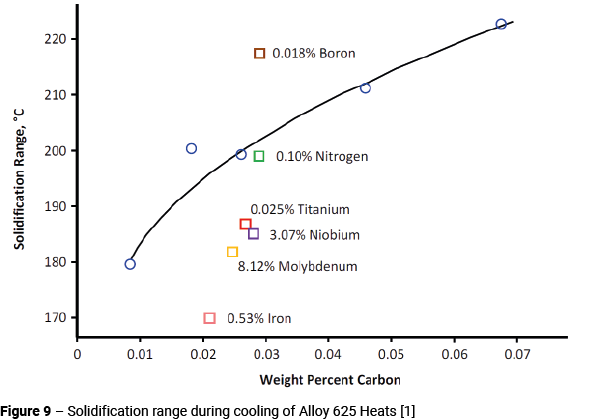
The carbon content also has an influence on the solidification range. Figure 9 shows a plot of the solidification range (liquidus temperature minus solidus temperature) during cooling versus the carbon content of a number of different heats [12, 13, 14]. The curve is drawn through the data for the heats with different carbon contents and shows that increasing the carbon content significantly increases the solidification range.

The effects of other individual alloying element variations are also evident. Increasing boron to 0.018% markedly increased the solidification range, because of the commonly observed effect of boron reducing the solidus temperature. Raising the nitrogen content (0.10%) had surprisingly little effect. Reducing the molybdenum, niobium, iron and titanium contents to close to the lower limits for these elements in Table 1 tended to reduce the solidification range. Cieslak [13] also found that minimising the silicon content significantly reduced the solidification range.
Reducing the solidification range is important as it should minimise the amount of segregation that takes place during solidification and, therefore, improve the hot workability. Thus, reducing the C and Nb contents is not only be beneficial in reducing the amount of material available to form NbC or Laves phase, but also in reducing the segregation of these elements during solidification.
The tendency to form NbC and/or Laves phases during solidification causes inherent limitations on melt practices. The melting procedure and ingot size taken together limit the maximum heat size that will have an acceptable structure. This limit is not well defined for Alloy 625, but for current electroslag remelting (ESR) melts, the maximum practical ingot size appears to be around 18 tonnes [1].
REFERENCES
- Stephen Floreen, Gerhard E. Fuchs, and Walter J. Yang, The Metallurgy of Alloy 625, The Minerals, Metals and Materials Society, 1994.
- Nash, P. 1991. Ni-Cr System, Phase diagrams of binary nickel alloys, P. Nash, ed., ASM International, Materials Park, OH, pp. 75-84.
- Singleton, M. F. and Nash, P. 1991. Ni-Mo System , Phase diagrams of binary nickel alloys, P. Nash , ed., ASM International, Materials Park, OH, pp. 207 – 212.
- The University of Tennessee Space Institute, 411 B H Goethert Parkway, Tullahoma, TN 37388
- Campbell, F. C. 2012. Phase Diagrams – Understanding the Basics, Ternary Phase Diagrams, F. C. Campbell, ed., ASM International, Materials Park, OH, pp. 191-200.
- Nelson, Stephen A. 2011. Ternary Phase Diagrams, Crystallization in Ternary Systems, EENS 2120, Tulane University, New Orleans, LA.
- Baker, H. 1992. Alloy phase diagrams, H. Baker, ed., ASM International, Materials Park, OH.
- Dupont, John N., Lippold, John C., Kiser, Samuel D. 2009. Welding Metallurgy and Weldability of Nickel-Base Alloys, John Wiley & Sons Inc., Hoboken, New Jersey.
- B. Radhakrishna and R. G. Thompson, Met Trans Vol. 22A, 1991, p. 887.
- Knorovsky, G. A., Cieslak, M. J., Headley, T. J., Romig, A. D., and Hammeter, W. F. 1989. Inconel 718: A solidification diagram, Metallurgical Transactions A, 20A: 2149 – 2158.
- DuPont, J. N., Robino, C. V., and Marder, A. R. 1998. Solidification of Nb – Bearing Superalloys: Part II. Pseudo Ternary Solidification Surfaces, Metallurgical and Material Transactions A, 29A: 2797 – 2806.
- M. J. Cieslak, T. J. Headley, T. Kollie and A. D . Romig Met Trans Vol. 19A, 1988, p. 2319.
- M. J. Cieslak Weld Journal Vol. 70, 1991, p. 49s.
- M. J. Cieslak, G. A. Knorovsky, T. J. Headley and A. D. Romig Met Trans Vol. 12A, 1986, p. 2107.

